Executive Summary
This Digital Property Seeker Series focuses on the supply and demand in the residential market during the fourth quarter of 2018, covering the following residential categories in the Philippines:
- Lot
- House
- Apartment
- Condo
This study will dive deep into these categories, identifying the top locations that experienced the most supply or demand increase, along with the reasons behind them based on data gathered independently by Lamudi and ColIiers Philippines covering the given period.
The Demand section was based on three indicators: Leads, Sessions, and Pageviews.
Page views are the total number of page visits. However, they are not unique views but an aggregate of all visits. Sessions are the number of times spent by a user in searching for a property. There can be multiple page views within each session. A Lead, on the other hand, refers to a property seeker that has made a query, which, may later on be converted into a sale.
October registered as the best performing month across all categories measured by the three indicators. Overall numbers in all categories, however, declined in December.
The Apartment category had the highest percentage of pageviews, sessions and leads for the fourth quarter. In last place was the House category. It is a shift worth noting as the house category generated the most interest in all three indicators in the prior quarter.
The study’s Supply section, on the other hand, will give a brief overview of the residential real estate trends for the fourth quarter of 2018. It will also discuss the general outlook of the residential sector for the entire year and a few points on the condominiums market in particular.
Data on the estimated number of condominium units currently available in the country will also be provided. This could give an insight on how difficult it is to meet the housing shortage despite the earnest efforts of private developers and the government, as well as show the current concentration of condominium projects in Metro Manila.
Supply Overview
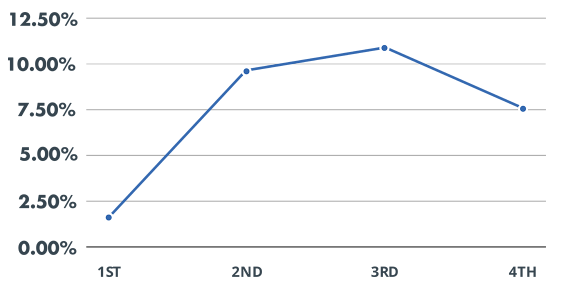
According to Lamudi’s exclusive data, from October to December 2018, the country saw the overall supply of its residential real estate properties take a slight dip to 7.45 percent. It was on a steady rise all throughout the year, beginning from a low of 1.72 percent in the first quarter. This jumped to 9.80 percent from April to June before peaking at 10.92 percent from July to September.